
How we built an AI-powered data platform that actually works (and runs on your laptop)
Why we Built This (And Why You Might Care)
Let me be honest: most data engineering tutorials show you how to query a CSV file and call it a day. That’s fine for learning SQL, but it’s not how real data platforms work. Real platforms have messy data coming from multiple sources, pipelines that need to run on schedule, dashboards that business people actually use, and monitoring so you know when things break (because they will).
So I built Silism Commerce 360 – a complete e-commerce analytics platform that mirrors what you’d find at a real company. It’s got everything:
- Data flowing in from databases and Kafka streams
- Transformations that clean and model the data
- An AI assistant that answers questions in plain English
- Dashboards that don’t look like they’re from 2005
- Monitoring that actually tells you what’s wrong
And here’s the kicker: it all runs locally on Docker. No cloud bills, no complicated setup, just docker-compose up and you’re running a production-grade data platform.
What you’ll learn from this post:
- How modern data platforms are actually architected
- How to get data from multiple sources into a data warehouse
- How to transform raw data into business insights with dbt
- How to add AI capabilities that aren’t just ChatGPT wrappers
- How to monitor everything so you sleep well at night
Let’s dive in.
The Architecture: How It All Fits Together
Before we get into the weeds, let me show you the big picture. Here’s how data flows through the platform:
Raw Data → Ingestion → Storage → Transformation → AI Layer → Dashboards
   ↓          ↓          ↓           ↓              ↓           ↓
Postgres     dlt      DuckDB       dbt Core      MCP Server  Streamlit
Kafka                                          + Ollama
The Components:
1. Data Sources
- PostgreSQL: Our fake e-commerce database with customers, orders, products, payments
- Kafka: Real-time stream of web events (page views, clicks, checkouts)
Think of this as your operational systems – the stuff that runs the business day-to-day.
2. Data Ingestion
- dlt (data load tool): Pulls data from Postgres and Kafka into our warehouse
- Handles incremental loading (only grabs new data, not everything every time)
- Keeps track of what’s been loaded with state management
This is the “extract and load” part of ELT (Extract, Load, Transform).
3. Data Warehouse
- DuckDB: Our analytics database (think of it as a lightweight, fast alternative to Snowflake)
- Stores everything in a single file (perfect for local development)
- Blazing fast for analytical queries
4. Data Transformation
- dbt Core: Transforms raw data into clean, business-ready models
- Staging layer: Cleans and standardizes the raw data
- Marts layer: Creates business-focused tables (revenue, customers, products)
This is where raw data becomes useful information.
5. Orchestration
- Apache Airflow: Schedules and runs all our data pipelines
- Astronomer Cosmos: Makes dbt and Airflow play nice together
- Manages dependencies (don’t transform data before you load it!)
6. AI & Query Layer
- MCP Server: A proper Model Context Protocol implementation (not just an API)
- Ollama: Runs AI models locally (we use Mistral)
- Converts “show me top customers” into actual SQL queries
- Generates business insights from data
7. Visualization
- Streamlit: Modern, interactive dashboards
- Multiple modules: executive dashboard, AI copilot, data explorer
- Actually looks good (sorry, Tableau)
8. Observability
- Prometheus: Collects metrics from everything
- Grafana: Visualizes those metrics in dashboards
- Loki: Aggregates logs
- Jaeger: Traces requests across services
- Uptime Kuma: Monitors service health
This is how you know what’s happening and what’s broken.
Why This Architecture?
You might be thinking: “That’s a lot of tools!” And you’re right. But here’s why each one matters:
- DuckDB instead of Postgres for analytics: DuckDB is built for analytical queries (aggregations, joins on large datasets). Postgres is built for transactions. Use the right tool for the job.
- dlt instead of custom Python scripts: dlt handles incremental loading, state management, and schema evolution. You could write this yourself, but why?
- dbt for transformations: SQL is the lingua franca of data. dbt lets you write modular, tested, documented SQL transformations. Plus, it generates lineage graphs automatically.
- MCP Server instead of direct LLM calls: MCP provides structure – tools, resources, prompts. It’s not just “throw a question at ChatGPT and hope.”
- Full monitoring stack: In production, you need to know when things break. This isn’t optional.
Getting It Running: From Zero to Data Platform in 10 Minutes
Alright, enough theory. Let’s actually run this thing.
Prerequisites
You need:
- Docker and Docker Compose (latest versions)
- 8GB RAM minimum (12GB recommended)
- 20GB free disk space
- A terminal and basic command-line skills
That’s it. No cloud accounts, no Kubernetes, no complicated setup.
Step 1: Clone and Start
# Clone the repository
git clone https://github.com/Silism/silism-commerce-360-platform.git
cd silism-commerce-360-platform

# Copy environment file (uses sensible defaults)
cp .env.example .env

# Start everything
./start-platform.sh
The startup script does a bunch of stuff automatically:
- Starts all Docker containers
- Waits for databases to be ready
- Downloads the Mistral AI model (this takes a few minutes first time)
- Initializes Airflow with an admin user
- Sets up the monitoring stack
Grab a coffee. First run takes about 5-10 minutes because it’s downloading the AI model (about 4GB).
Step 2: Verify Everything Started
# Check all services are running
docker ps
You should see about 15+ containers running. If something’s not running, check the logs:
# View logs for a specific service
docker-compose logs -f [service-name]

# For example, check Airflow scheduler
docker-compose logs -f airflow-scheduler
Step 3: Access the Services
Open your browser and check these URLs:
| Service | URL | What It Does |
|---|---|---|
| Streamlit Dashboard | http://localhost:8501 | Main analytics interface |
| Airflow | http://localhost:8080 | Pipeline orchestration (admin/admin) |
| Grafana | http://localhost:3001 | Monitoring dashboards (admin/admin) |
| Kafka UI | http://localhost:8081 | View Kafka topics |
Step 4: Run Your First Data Pipeline
Now we need to actually load some data. Head to Airflow at http://localhost:8080 and log in with admin/admin.
You’ll see a DAG called ecom_data_pipeline. This is our main data pipeline that:
- Runs dbt source tests (validates raw data)
- Ingests data from Postgres (customers, orders, products, etc.)
- Ingests web events from Kafka
- Runs dbt staging models (cleans the data)
- Runs dbt marts models (creates business tables)
Click on the DAG, then click the play button (▶️) in the top right to trigger it manually.
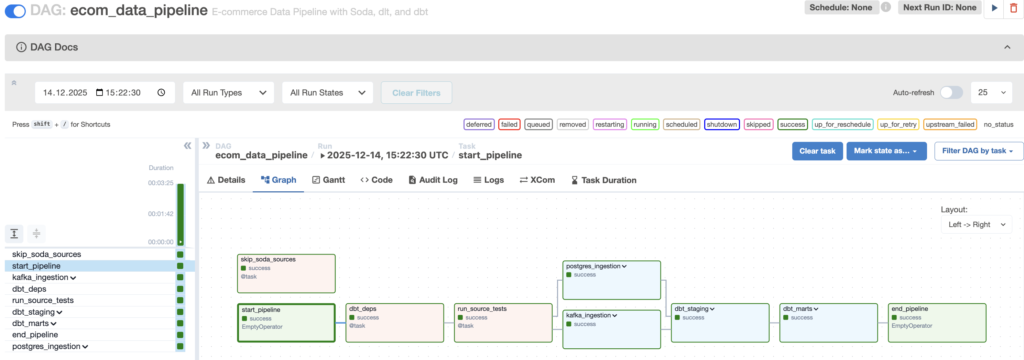
This will take 2-5 minutes to complete. You can watch the tasks turn green as they finish. If something fails, click on the task and check the logs.
Step 5: Check the Data in DuckDB
Once the pipeline finishes, let’s verify the data actually made it into DuckDB.
# Connect to the DuckDB database
docker exec -it silism-duckdb python -c "
import duckdb
conn = duckdb.connect('/data/warehouse.duckdb')

# List all tables
print('=== Available Tables ===')
result = conn.execute('''
    SELECT table_schema, table_name
    FROM information_schema.tables
    WHERE table_schema NOT IN ('information_schema', 'pg_catalog')
    ORDER BY table_schema, table_name
''').fetchall()

for schema, table in result:
    print(f'{schema}.{table}')

# Check some data
print('\n=== Sample Customer Data ===')
customers = conn.execute('SELECT * FROM main.dim_customers LIMIT 5').fetchdf()
print(customers)

print('\n=== Revenue Summary ===')
revenue = conn.execute('''
    SELECT
        order_year,
        order_month,
        COUNT(DISTINCT customer_fk) as customers,
        SUM(total_orders) as orders,
        ROUND(SUM(total_revenue), 2) as revenue
    FROM main.fct_monthly_revenue
    GROUP BY order_year, order_month
    ORDER BY order_year DESC, order_month DESC
    LIMIT 6
''').fetchdf()
print(revenue)

conn.close()
"
You should see:
- Staging tables (prefixed with stg_): Raw data, cleaned up
- Dimension tables (prefixed with dim_): Customers, products, dates
- Fact tables (prefixed with fct_): Revenue, orders, customer journeys
This is the star schema – the foundation of dimensional modeling.
Step 6: Explore the Data Visually
Now let’s look at the data in a more human-friendly way. Open Streamlit at http://localhost:8501.
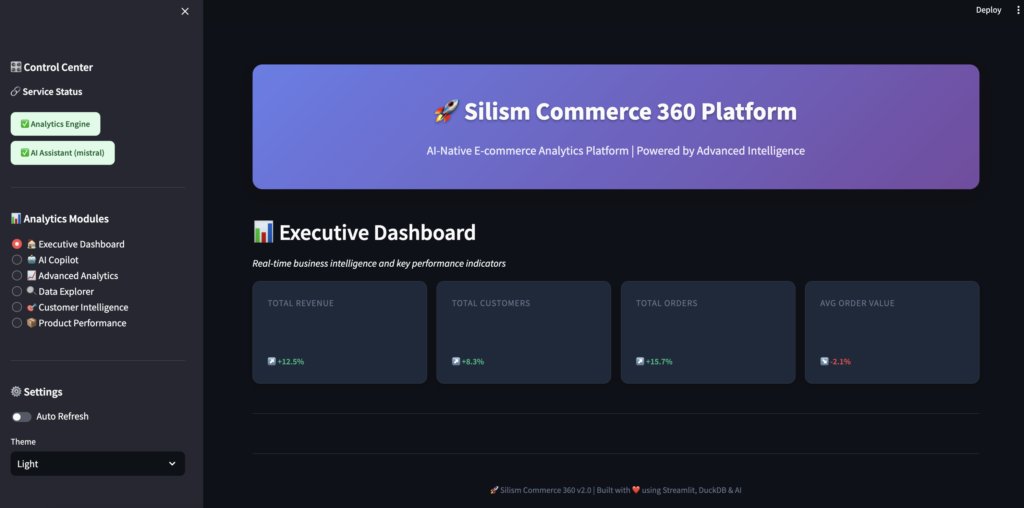
You should see:
- ✅ Analytics Engine connected
- ✅ AI Assistant ready (with Mistral model)
- Navigation sidebar with different modules
What’s Next: The Complete User Experience
This covers getting the platform up and running, understanding the architecture, and loading your first data. But the real magic happens when you start exploring the data through the Streamlit interface and using the AI assistant.
In Part 2 of this series, we’ll dive deep into:
- The complete Streamlit dashboard walkthrough
- How to use the AI Copilot for natural language queries
- Advanced analytics modules (cohort analysis, customer segmentation)
- The comprehensive monitoring setup with Grafana and Prometheus
- Performance optimization and lessons learned
- Scaling considerations for production deployments
👉 Read Part 2: The Complete User Experience and Monitoring →
Try It Yourself
The entire platform is open source and available on GitHub:
👉 github.com/Silism/silism-commerce-360-platform
Clone it, run it, break it, fix it, extend it. That’s how you learn.
If you build something cool with it, let me know! I’m always curious to see what people create.
Built with ❤️ by Silism — Empowering Data Teams with AI-Native Platforms